
| Cerius2 Modeling Environment |
While most applications in Cerius2 have customized panels for grid manipulations, Isosurfaces offers a wider range of options. It makes it convenient to manipulate a large number of surfaces; it allows stepwise progress through a range of isocontour values, and it lets you use grid files created with external applications.
You should already know...
The basics of starting Cerius2 and using its interface are demonstrated in Introducing Cerius2 and described in The Cerius2 Interface.
Grids in Cerius2 are produced as output from calculations in various other application modules. How to set up and run the appropriate calculations are discussed in the documentation for the relevant application modules.
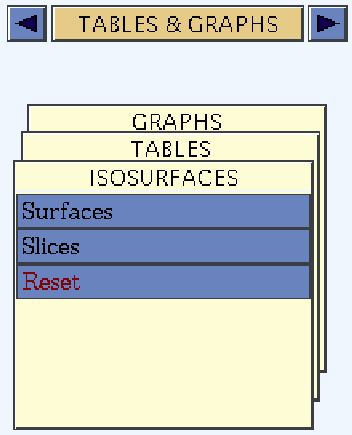
The tools for handling isosurfaces are accessed from one of the decks of cards in the main Visualizer control panel. To access the TABLES & GRAPHS module, click the deck selector and choose TABLES & GRAPHS from the list that appears. Then click the title of the ISOSURFACES card to bring it to the front. The deck of cards menu area should now look like this:

Three dimensional grid properties such as orbitals, densities, and potentials are scalar functions that are defined in the continuous 3D space surrounding the model. In practice, they are evaluated on a fine grid of points that completely encompass the model. This produces a large amount of information, which is typically visualized as an isosurface; that is, the constant-value points surrounding the model are connected so as to form a surface. The data can also be visualized as slices showing the values of the function on a 2D plane cutting through the model.![]()
Analyzing 3D grid properties
If you want to display a currently undisplayed surface, use the Files... pushbutton to access the Isosurfacing Files control panel. Select the desired .grd or .mbk file and click the LOAD button. You can use the browser popup to access directories other than the current one.
Once you have a surfacing file loaded and if the default settings in the Isosurfaces control panel are satisfactory, you can click the Create New Surface action button (on the Isosurfaces control panel) to create and display that surface on your model. Make sure that none of the surfaces in the list box is selected if you want to create and display a new surface in addition to those already displayed.
Please see the on-screen help for details on the functioning of each control.
Mapping a property onto a surface
How maps on surfaces
function
An isosurface connects points in space that have the same value of some parameter. However, you can add an additional dimension to a surface, by making a property map, which displays the values of another property as different colors on an existing displayed surface.
Specify a property to be mapped by choosing the desired .grd or .mbk file from the list box and clicking the LOAD pushbutton. You can use the browser popup to access directories other than the current one.
If more than one surface is displayed or has been loaded, you may need to select the one on which to map the property, using the list box on the Isosurfaces control panel.
Please see the on-screen help for details on the functioning of each control.
Editing and displaying slices
To edit and display a 2D slice through the 3D grid of orbitals, density, or potential for your model, use the Slices control panel, which is accessed by clicking the Slices menu item on the ISOSURFACES card.
If necessary, choose the grid file to be analyzed by clicking the Files... pushbutton to access the Isosurfacing Files control panel. Select the desired .grd or .mbk file from the list box and click the LOAD pushbutton. You can use the browser popup to access directories other than the current one.
Once you have loaded a file and if the default settings in the Slices control panel are satisfactory, click the Create New Slice action button (on the Slices control panel) to create and display a selected slice for your model. You may want to edit the slice now (e.g., by changing the transparency value and redisplaying).
A slice is defined by its position and direction. The default position and direction are chosen so that the slice passes through the best-fit plane to the whole model or any selected atoms. A slice is created with a default position and direction and can be returned to the default position or direction by clicking the appropriate reset action button.
Clicking the Preferences... pushbutton gives you access to the Slice Preferences control panel, which contains additional controls that affect slices.
To create a 2D contour graph corresponding to a selected slice plane, click the Create Slice Plot in Graph Window action button in the Slices control panel.
Please see the on-screen help for details on the functioning of each control.
