The Figure (a) shows the classical electronic orbits of an electron bound to an unmovable mass center by an isotropic elastic force in the presence of a magnetic field, H. The orbits have been slightly displaced for reasons of presentation. The normal vibrations are labeled s, s, p, where s stands for "senkrecht" = perpedicular and p for parallel. The oscillator p is not affected by the magnetic field; the oscillators s, s have frequencies that lie symmetrically below and above the unperturbed frequency of the p oscillator, Figure (c, f). This effect was observed by Zeeman in measurements of the emission spectra of sodium (the D1 and D2 bands) contained in a flame. The splitting amounts twice the Larmor angular frequency, which is linear in the field and proportional to the ratio of the charge and the mass of the electron:
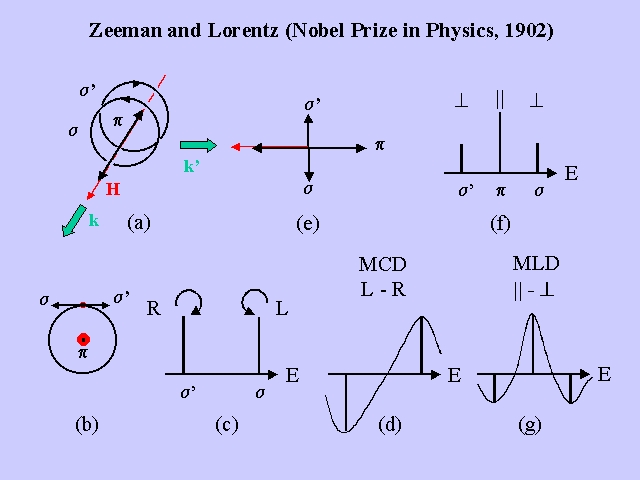
The magnetic
spectra observed by Zeeman revealed an intensity difference in the emission
of polarized light. Thus, the emitted light exhibits an effect called magnetic
dichroism. Moreover, the dichroism was found to depend on the frequency
of the light, a phenomenon called dispersion. Early in the 19th
century it had been shown by Fraunhofer that absorption and emission phenomena
observed for the same material give rise to spectra with identical line
positions. Thus, the magnetic dichroism described above must also be observable
in absorption spectra, and actually is. Figure (d)
indicates that Magnetic Circular Dichroism (defined as the difference
in absorption of Left and Right circularly polarized light)
is observed in parallel observation. Figure (g)
indicates that Magnetic Linear Dichroism (defined as the difference
in the absorption of Parallel and Perpendicular linearly
polarized light) is observed in perpendicular observation. The differential
spectra are obtained from the Zeeman spectra by flipping the sign of one
of the stick components (Figure (d, g)). Taking
into account the bandwidth of the electronic transition (which, in the
case of molecular systems is considerably larger than magnetic splitting
due to coupling to nuclear vibrations), one obtains the 1st
and 2nd derivative contours for MCD and MLD, respectively, shown
in Figure (d, g). In the current literature, these
spectra are designated A1 (MCD) and A2 (MLD). The
A1 MCD spectrum is proportional to minus the derivative
of the absorption band, the sign being for an elastically bound particle
with a negative charge. In other words, the differential absorption
spectrum, as deduced from the Zeeman spectrum, provides the sign of the
electronic charge, a matter that remained unsettled till Zeemans work
and Thompsons discovery of the free electron in the same year.
Noting that