
| Quantum 1 Modules |
This section includes:
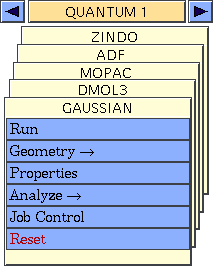
After starting Cerius2, select the QUANTUM 1 card deck and then the GAUSSIAN card. This gives you access to functionality for setting up and running your Gaussian job and analyzing the results. The QUANTUM 1 card deck should now look like:
This section explains how to use the Cerius2 Gaussian interface and does not discuss the Gaussian application in any detail. To learn more about Gaussian, please refer to documentation provided by Gaussian Inc., as well as their website (see Other relevant websites).
Types of calculation tasks
![]()
Typical Gaussian calculations
This section describes how to perform some of the basic tasks for which Gaussian is used:
Additional tasks are also available. For additional information, please see the on-screen help for the Run Gaussian and Gaussian Tasks control panels (see Setting up and starting calculations), as well as the Gaussian documentation supplied by Gaussian, Inc.
For all calculations, you need to have a model present in Cerius2. For information on building and reading in models, please see Cerius2 Modeling Environment (published separately by MSI).
A typical Gaussian session involves several phases:
Who should read this section
If your model structure is satisfactory, you do not need to read this section and may proceed to Optional job control issues.
Read this section if you want information on:
Setting geometric constraints
What constraints are used for
The Gaussian program supports partial optimizations, transition-state searches, and potential scans. That is, the coordinates of some atoms are allowed to vary, while the positions of other atoms remain fixed during a calculation. This can decrease computation time considerably. The parts of the model to keep fixed or to allow to vary during optimization can be specified in either internal or Cartesian coordinates.
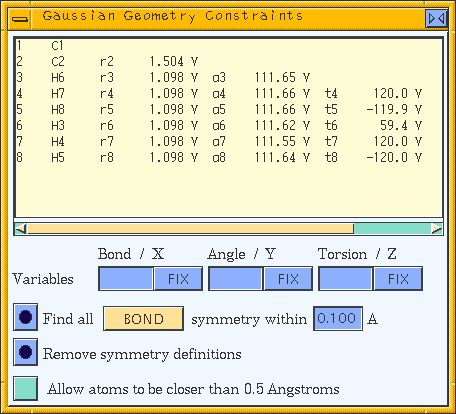
The list box in this control panel shows a Z-matrix specifying the model's geometry. By default, Vs are placed next to each coordinate value, indicating that all coordinates are free to vary. The rn, an, and tn labels are the names of each distance, angle, and torsion variable, respectively. You may change these names in the Variables entry boxes.
Tip
|
If only a column of atom numbers is displayed in the Z-matrix list, then no Z-matrix information is available for the model. Z-matrix information can be obtained by using the Z-Matrix editor (see Editing Z-matrices), by saving a job input file for the model (the Gaussian interface calculates the Z-matrix when generating the file), or from an output file selected for analysis. |
Detailed information on Z-matrices is contained in Quantum 1 Module Utilities.
Which atoms correspond to which line in the Z-matrix?
To identify the atoms in your model more easily, you may label them by selecting NUMBERS from the label-style popup (second control from the left in the tool bar of the man Visualizer control panel).
Clicking the Find all symmetry action button automatically finds and assigns Z-matrix variable names to account for BOND, ANGLE, TORSION, X, Y, or Z (as determined by the associated popup) symmetry within the current model. Use the corresponding entry box to specify a tolerance factor (in angstroms or degrees, as appropriate) within which parameters should be considered equal for the purposes of the application of symmetry constraints.
When you click the Remove symmetry definitions action button, the symmetry definition(s) are removed from the selected Z-matrix line.
Please see the on-screen help for additional information on the controls in this panel.
Finding and setting the point-group symmetry for your model
With the Gaussian Symmetry control panel (which is accessed by selecting the Geometry/Symmetry menu item on the GAUSSIAN card), you can find the symmetry group of all or some of the atoms in your model within a desired level of tolerance. You can also enforce exact symmetry upon the conformation of all or part of your model and specify that symmetry be used in your Gaussian calculation.
Using symmetry in an Gaussian run can significantly reduce the computational effort. The number of integrals that need to be evaluated and the number of degrees of freedom in geometry and transition-state calculations are reduced.
If you want only to find the point-group symmetry of all or part of your model:
Setting exact symmetry
If you also want to enforce exact symmetry by snapping the atoms to their exact symmetry positions and/or reorienting the structure to the symmetry axes, make sure that the check boxes for Snap Atoms to Exact Symmetry and/or Re-Orient Atoms to Symmetry Axes are checked when you click the Find symmetry action button.
If you find that you need to use very large tolerance values, you should probably use the Bond Geometry control panel (accessed by selecting the Move/Bond Geometry... item from the menu bar at the top of the main Visualizer control panel) to manually adjust the geometry before using the Gaussian Symmetry control panel.
The symmetry found in this step is automatically used by Gaussian if possible. Otherwise, the program automatically chooses the most appropriate related symmetry group.
Editing the Z-matrix for your model
Please see Editing Z-matrices, since this functionality is found in all the Quantum 1 applications.
Nondefault job-control conditions are set with the Gaussian Job Control control panel, which you access by clicking the Job Control menu item on the GAUSSIAN card.![]()
Optional job control issues
If you intend to run Gaussian on the same machine on which you are running Cerius2 and do not care about monitoring the job while it runs or about transferring files, you do not need to read this section and may proceed to Setting up and starting calculations.
Read this section if you want information on:
Interactive
In interactive mode, Cerius2 displays the Gaussian logfile output so you can monitor the progress of the jobs. However, you cannot do anything else in the Cerius2 interface until the job is complete, so this mode is useful only for jobs that you expect to finish quickly.
In background mode, the job runs without communicating with the Cerius2 interface, and you can quit Cerius2, allowing the job to run by itself. When you exit Cerius2, a status file is automatically saved so that, if Cerius2 is restarted, the job can be selected for monitoring or (if it has finished) the output files can be read in for analysis (Studying Gaussian output).
In NQS mode, the job is submitted to the Network Queueing System, provided that this software has been installed, on the local or remote host. Once the job is queued, you can quit Cerius2, allowing the job to run by itself. An NQS-mode job can be selected for monitoring or file transfer in a later Cerius2 session.
Selecting a machine and base directory
By default, the Gaussian job runs on the machine on which you are running Cerius2. However, you may, for example, send it to a faster machine.
Click the Hosts arrow in the Gaussian Job Control control panel to obtain a pulldown listing machines at your site to which you can send the Gaussian job. The list contains all suitable hosts on your network (as defined in applcomm.db--for a description and example file entries, see the Cerius2 Installation and Administration Guide).
Depending on your site's setup, you might not have permission to run on all the machines listed in the pulldown, or you may need to specify a user ID and password to access some machines. Use the Options... pushbutton to access the Gaussian Job Control Options control panel, where you can input a User ID and Password before selecting your host machine.
Tip
|
If in doubt about any of the options relating to machines and network configuration at your site, please see your system administrator. |
You also need to specify a working (base) directory on the host machine if the default specification is not correct. For more information on how to do this, as well as whether files need to be transferred between machines in consequence, please see the on-screen help (click the right mouse button while the cursor is over the Base Directory entry box).
Setting up NQS-mode jobs
Setting Run Mode to NQS on the Gaussian Job Control control panel causes a More... pushbutton to appear. This button provides access to the NQS Control control panel, which allows you to set commonly used NQS flags (such as queue name and time and memory limits) and to set the names of the commands used to submit, monitor, and kill NQS jobs on the chosen host.
Other output options
Gaussian output options governing output style, job archiving, and additional output files can all be set on the Gaussian Output Options control panel, accessed by clicking the Output Options... pushbutton on the Run Gaussian control panel.
Monitoring and controlling running jobs
The Cerius2 Gaussian Job Status list box in the Gaussian Job Control control panel shows the filenames and directories associated with your Gaussian runs. For each job, the list shows the host name, datafile prefix, status (started, running, or complete for interactive and background jobs, or NQS_SUB, NQS_RUN, or complete for NQS jobs), process (PID) or NQS-request ID, and working directory. Click the UPDATE pushbutton to update this list. To remove an item from the list (if that job has completed), click the REMOVE pushbutton.
Tip
|
The status of the job is updated only if you click the UPDATE pushbutton, not if you merely close the Gausssian Job Control control panel or exit the Cerius2 session. |
Transferring files from one machine to another
The Gaussian interface automatically handles the transfer of generated input files to a remote host when you start interactive, background-, or NQS-mode remote jobs. After job completion, all the output files are recovered automatically for interactive jobs.
Note
|
The remote file system may actually be the same as your local file system (if, for example, it is NFS mounted the same way on both systems). In this case, no transfer of files is necessary. |
To start your Gaussian run from within the Cerius2 interface, access the Run Gaussian control panel by selecting the Run menu item on the GAUSSIAN card.![]()
Setting up and starting calculations
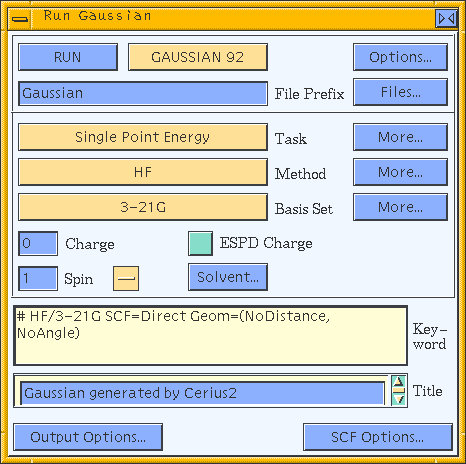
If the default task (single-point energy calculation) and other options are satisfactory, you need only click the RUN pushbutton in the Run Gaussian control panel to start your run.
If you are sure that the default task is appropriate to your computational problem, you do not need to read this section and may run the job and then proceed to Studying Gaussian output.
Read this section if you want information on:
A wide variety of tasks is available, and some may be combined. For complete lists and descriptions of available calculation tasks, approximation methods, and basis sets, see Gaussian 92 User's Guide or Gaussian 94 User's Reference.
Specifying tasks
Specify the Gaussian calculation task by selecting the appropriate task from the Task popup.
Single-point energy calculations
To specify a single-point energy calculation (i.e., compute the SCF solution for the input geometry), set the Task popup in the Gaussian Run control panel to Single Point Energy. You may want to set additional options (Approximation methods) before clicking the RUN pushbutton in the Gaussian Run control panel.
Geometry optimizations
To optimize the geometry (minimize the energy) of your model, set the Task popup in the Gaussian Run control panel to Geometry Optimization.
Click the More... pushbutton in the Gaussian Run control panel (next to the Task popup) to open the Gaussian Tasks control panel, which you can use to control the optimization iterations, convergence criteria, and other options.
Transition-state optimizations
To optimize a transition state for your model (i.e., to find a saddle point on the potential energy surface), set the Task popup in the Gaussian Run control panel to TS Optimization.
Click the More... pushbutton in the Gaussian Run control panel (next to the Task popup) to open the Gaussian Tasks control panel, which you can use to control the optimization iterations, convergence criteria, and other options.
Frequency calculations
To calculate the vibrational modes and frequencies of your model, set the Task popup in the Gaussian Run control panel to Frequency.
Click the More... pushbutton in the Gaussian Run control panel (next to the Task popup) to open the Gaussian Tasks control panel, which you can use to specify various options.
Scanning the potential energy surface
To perform a sequence of related geometry optimizations for your model (e.g., to systematically vary one or more torsion angles and to optimize the geometry at each defined set of torsion angles), set the Task popup in the Gaussian Run control panel to Scan Potential Surface.
Click the More... pushbutton in the Gaussian Run control panel (next to the Task popup) to open the Gaussian Tasks control panel, which you can use to specify the scan dimensions.
To systematically vary one or two bond lengths, dihedral angles, and/or torsion angles, these items must be defined as named variables in the Gaussian Geometry Constraints control panel (Setting geometric constraints).
Although you can define two variables, scanning in Gaussian is one-dimensional. That is, both variables are changed simultaneously.
To define the limits between which to change the varied coordinates, enter the variable's name in the Name entry box in the Gaussian Tasks control panel and enter the desired start and stop values and the number of steps in the respective entry boxes below the Name entry box.
Other tasks
Only some of the tasks that Gaussian is capable of are mentioned above, for a complete list, please see the popup at the top of the Gaussian Tasks control panel.
Approximation methods
Gaussian offers several different ab initio, semi-empirical, density functional, and excited-state approximation methods (commonly referred to as levels of theory) for task calculation. Among the available methods are:
The Gaussian Methods control panel (accessed by clicking the More... pushbutton to the right of the Method popup on the Run Gaussian control panel) contains controls that allow you to choose from the complete range of available approximation methods and to set related options.
Basis sets
Basis sets provide a mathematical representation of the molecular orbitals within a model, effectively restricting each electron to a particular region of space. Larger basis sets impose fewer constraints on electrons and, consequently, lead to a better description of the electronic structure of the model. The computational resources required are correspondingly greater than for smaller sets. Among the available basis sets are:
If you want to use a nondefault basis set, select another one from the Basis Set popup in the Run Gaussian control panel.
Specifying charge and spin
Regardless of the type of calculation you want to perform, if your model is not neutral you need to inform Gaussian of its charge by entering a value in the Charge entry box of the Run Gaussian control panel. Enter 0 for a neutral molecule, 1 for a singly charged cation, etc.
SCF options
To change the default values for the parameters that control how SCF is achieved, click the SCF Options... pushbutton in the Run Gaussian control panel, which gives you access to the Gaussian SCF Options control panel.
Solvation effects
Although most calculations are performed for the gas phase, these calculations are inadequate for describing many systems in solution. Where the combination of task and approximation method permit, Gaussian can predict energies, structures, and frequencies for systems in solution.
Access the Solvation Model control panel by clicking the Solvent... pushbutton on the Run Gaussian control panel. This panel contains controls that allow you to set the solvation model and associated options to be used for your job.
Property calculation
In addition to the fundamental wavefunction calculations to be performed according to your specified calculation tasks, you can also calculate a range of other properties. Although they are also calculated during the Gaussian run, properties are distinguished from tasks in that, given the wavefunction (determined as part of the calculation task), these attributes can be obtained relatively cheaply. That is, properties are readily calculated; anything that requires significant calculation effort is a task.
The Gaussian Properties control panel (accessed by selecting the Properties menu item from the GAUSSIAN card) contains controls that allow you to specify properties to be calculated, as well as associated options.
Handling and naming Gaussian input files
Filenames
Gaussian input files generated by Cerius2 have the file extension .com. To change the default root name (prefix) for input and output files associated with your run, edit the contents of the File Prefix entry box in the Run Gaussian control panel. Alternatively, you can select a root name from existing datafiles using controls on the Gaussian Input File control panel (Saving, editing, and using input files). We refer to this root (or "seed") name as run_name in this section.
To change the default title for your run, edit the contents of the Title entry box in the Run Gaussian control panel. This descriptive text is included in the input and output files associated with your run, to aid in file identification.
Before you run your job (passing the Gaussian interface-generated input file to the Gaussian software), you can review the commands that reflect your defined options. Review the commands using the Keyword scrolling list box on the Run Gaussian control panel.
For other aspects of file handling, access the Gaussian Input File control panel by clicking the Files... pushbutton in the Run Gaussian control panel.
You may be able to manually obtain or to extrapolate all the information that you require from the data in the log and checkpoint files. However, the Gaussian interface provides a set of analysis tools that you can use to analyze information from these files and readily visualize the results using the rich Cerius2 graphical display functionality.
Information that can be analyzed using the Gaussian analysis tools includes:
Output from the last Gaussian job completed in interactive mode during the current Cerius2 session is automatically selected for analysis. Any graphs produced (IR spectrum, energy vs. structure number) are automatically displayed at the end of the run.
The list box in the Gaussian File Analysis control panel shows the relevant files in your current directory. You can browse other directories by using the popup menu above the list box. If a file named run_name.fchk is present, the run has ended and the results can be analyzed.
By default, when you SELECT a run_name.fchk file, the associated Gaussian model is automatically loaded into the model display window, and graphs of any relevant properties present in the file are automatically generated. You may want to prevent this for some reason (see Loading models and structures for how to load models after loading the run_name.fchk file). To unset these automatic options (before you click the SELECT pushbutton), uncheck the Recover Model on Selecting File check box.
Output file identification and contents
The job identification, run time, and title (see Run title on setting a nondefault title) are displayed in the Summary of Calculation list box in the Gaussian File Analysis control panel after you SELECT a file.
Clicking the Examine Gaussian Logfile action button displays the results of the calculation in text format (run_name.log).
Analyzing coordinates, charges, and dipoles
You may change the defaults for recovering your model and graph, for display of the dipole vector, and for analysis of the output for your run with the Gaussian Model Analysis control panel. Access this panel by selecting the Analyze/Models menu item on the GAUSSIAN card.
If you did not automatically load the model when you specified which file to analyze (Before you load the output files ...), you may load it by clicking the Recover Model action button.
Displaying the dipole moment vector
The check box for Show Dipole Vector, the Color popup, and the Display Scale entry box control the display of a vector indicating the dipole moment of the model.
Analyzing vibrational frequencies and normal modes
When you select the output file (Choosing the Gaussian output files to be analyzed) from a frequency run for analysis, the IR spectrum is automatically displayed in a graph window, and the lowest normal mode is displayed on the model. Selecting a peak in the graph window automatically shows the corresponding normal mode in the model window.
The Gaussian Vibration control panel, which is accessed by selecting the Analyze/Vibrations menu item on the GAUSSIAN card, displays a full list of normal modes and their frequencies, as well as IR and Raman intensities. As modes are picked in the graph, the corresponding mode in the control panel is highlighted.
The Display Selected Mode section of the Gaussian Vibration control panel controls the Cerius2 model window.
Finally, you may scale the calculated frequencies by a Frequency Scale Factor, so that they agree better with experimental frequencies.
Analyzing orbitals, densities, and potentials
Orbitals, densities, and potentials are scalar functions that are defined in the continuous 3D space surrounding the model. In practice, they are evaluated on a fine grid of points that completely encompass the model. This produces a large amount of information, which is typically visualized as an isosurface; that is, the constant-value points surrounding the model are connected as a surface. The data can also be visualized as slices showing the values of the function on a plane cutting through the model.
Calculating orbitals
You can calculate (and display, see also Displaying orbitals, densities, and potentials as surfaces) the molecular orbitals, appropriately oriented with respect to the displayed model. To do this, use the Gaussian Orbitals control panel, which is accessed by selecting the Analyze/Orbitals menu item on the GAUSSIAN card.
Which orbitals to calculate and display
You may calculate orbitals for electrons with alpha or beta spin by choosing Alpha or Beta from a popup. The alpha or beta orbitals are shown in the list box, as well as their energies. Select an orbital from the list or choose HOMO or LUMO to quickly select the highest occupied molecular orbital or lowest unoccupied molecular orbital.
To display more than one calculated orbital simultaneously, use the Gaussian Surfaces control panel (Displaying orbitals, densities, and potentials as surfaces).
You can control the resolution with which the grid is calculated, through a popup. LOW-resolution grids are faster to calculate and display, HIGH-resolution grids give the highest-quality graphic output, and MEDIUM-resolution grids represent a compromise between these considerations.
Click the Preferences... pushbutton if you want to turn off automatic (re)creation of orbital surfaces or change the default name of the file in which to save the calculated orbital grid.
Calculating the electron density
You can calculate (and display, see also Displaying orbitals, densities, and potentials as surfaces) the electron density, appropriately oriented with respect to the displayed model. To do this, use the Gaussian Density control panel, which is accessed by selecting the Analyze/Density menu item on the GAUSSIAN card.
You can calculate the density, the Laplacian of the density, or the norm of the density gradient. In addition, you may calculate the total charge density, the alpha or beta charge densities, or the difference between the alpha and beta densities (which is the spin density).
Click the Preferences... pushbutton if you want to include the core density in the calculations, change the level of approximation at which the density is calculated, turn off automatic (re)creation of electron density surfaces, and/or change the default name of the file in which to save the calculated density grid.
Calculating the electrostatic potential
You can calculate (and display, see also Displaying orbitals, densities, and potentials as surfaces) a representation of the electrostatic potential, appropriately oriented with respect to the displayed model. To do this, use the Gaussian Potential control panel, which is accessed by selecting the Analyze/Potential menu item on the GAUSSIAN card.
You can control the resolution with which the grid is calculated, through a popup.
Click the Preferences... pushbutton if you want to change the level of approximation at which the potential is calculated, turn on or off automatic (re)creation of electrostatic potential surfaces, and/or change the default name of the file in which to save the calculated potential grid.
Displaying orbitals, densities, and potentials as surfaces
When you need to use this control panel
To display the orbitals, electron density, or potential for your model as a surface or to change the display of an existing surface, use the Gaussian Surfaces control panel, which is accessed by selecting the Analyze/Surfaces menu item on the GAUSSIAN card.
If you want to display a currently undisplayed surface, use the Files... pushbutton to access the Gaussian Surfacing Files control panel. Select the desired run_name_property.cube file and click the LOAD button. You can use the browser popup menu to access directories other than the current one.
Once you have a surfacing file loaded and if the default settings in the Gaussian Surfaces control panel are satisfactory, you can click the Create New Surface action button (in the Gaussian Surfaces control panel) to create and display that surface on your model. Make sure that none of the surfaces in the list box is selected if you want to create and display a new surface in addition to those already displayed.
An isosurface connects points in space that have the same value of some parameter. However, you can add an additional dimension to a surface, by making a property map, which displays the values of another property as different colors on an existing displayed surface.
Specify a property to be mapped by choosing the appropriate run_name_property.cube file from the list box and clicking the LOAD pushbutton. You can use the browser popup menu to access directories other than the current one.
If more than one surface is displayed or has been loaded, you may need to select the one on which to map the property, using the list box in the Gaussian Surfaces control panel (Displaying orbitals, densities, and potentials as surfaces).
Click the Add Property action button to display the property map.
Editing and displaying slices
To edit and display a 2D slice through the 3D grid of orbitals, density, or potential for your model, use the Gaussian Slices control panel, which is accessed by selecting the Analyze/Slices menu item on the GAUSSIAN card.
If necessary, choose the orbital, density, or potential file to be surfaced by clicking the Files... pushbutton to access the Gaussian Surfacing Files control panel (Finding your surfacing files). Select the appropriate run_name_property.cube file from the list box and click the LOAD pushbutton. You can use the browser popup menu to access directories other than the current one.
Slice specification and display
Once you have loaded a .cube file and if the default settings in the Gaussian Slices control panel are satisfactory, you can click the Create New Slice action button (in the Gaussian Slices control panel) to create and display a selected slice for your model.
A slice is defined by its position and direction. The default position and direction are chosen so that the slice passes through the best-fit plane to the whole model or any selected atoms. A slice is created with a default position and direction and can be returned to the default position or direction by clicking the appropriate reset buttons.
Clicking the More Editing Options... pushbutton gives you access to the Gaussian Slice Preferences control panel, which contains additional editing options.